Showing posts with label CUDA. Show all posts

Sunday, September 18, 2016

NVidia Pascal's GPU architecture most exciting feature

Few months ago NVidia announced the Pascal GPU architecture and more specifically the GP100 GPU. This is a monstrous GPU with more than 15 billion transistors built using a 16nm FinFET fabrication. Though, the alleged performance numbers are arguably impressive (10.6 TFlops SP, 5.3 TFlops DP) I personally think that this is not the most impressive feature of this GPU.

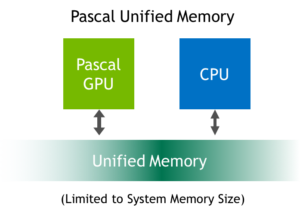
The most impressive feature I found on as advertised is the unified memory support. In CUDA 6 and CC3.0 & CC3.5 devices (Kepler architecture) this term had been first introduced. But it didn't actually provide any real benefits at the time other than programming laziness. In particular, the run-time took care of moving the whole data to/from the GPU memory whenever it was used on either the host or GPU. The GP100 memory unification seems far more complete as according to specifications it seems to take memory unification to the next level. It supports data migration at the granularity of memory page! This means that programmer is able to "see" the whole system memory and the run-time takes care of which memory page should be moved at the time it is actually needed. This is a great feature! It allows porting CPU programs to CUDA without caring which data will actually be accessed.

For instance, imagine having a huge tree or graph structure and and you have a GPU kernel that needs to access just a few nodes on it without knowing which beforehand. Using the Kepler memory unification feature would require copying the whole structure from the host to GPU memory which could potentially cannibalize performance. The Pascal memory unification would actually copy only the memory pages residing on the accessed nodes, instead. This releases programmer from a great pain and that's why I think this is the most exciting feature.

I really hope this feature will be eventually supported on consumer GPU variants and stays not just an HPC feature for in Tesla products. I also hope that AMD will also support such a feature in its emerging ROCm platform.

Resources:

Sunday, November 22, 2015

mixbench benchmark OpenCL implementation

Four and a half months ago I posted an article about mixbench benchmark. This benchmark was used to assess performance of an artificial kernel with mixed compute and memory operations which corresponds to various operational intensities (Flops/byte ratios). The implementation was based on CUDA and therefore only NVidia GPUs could be used.

Now, I've ported the CUDA implementation to OpenCL and here I provide some performance numbers on an AMD R7-260X. Here is the output when using 128MB memory buffer:

mixbench-ocl (compute & memory balancing GPU microbenchmark)
Use "-h" argument to see available options
------------------------ Device specifications ------------------------
Device:              Bonaire
Driver version:      1800.11 (VM)
GPU clock rate:      1175 MHz
Total global mem:    1871 MB
Max allowed buffer:  1336 MB
OpenCL version:      OpenCL 2.0 AMD-APP (1800.11)
Total CUs:           14
-----------------------------------------------------------------------
Buffer size: 128MB
Workgroup size: 256
Workitem stride: NDRange
Loading kernel source file...
Precompilation of kernels... [>>>>>>>>>>>>>>>>>>>>>>>>>>>>>>>>>]
--------------------------------------------------- CSV data --------------------------------------------------
Single Precision ops,,,,              Double precision ops,,,,              Integer operations,,,
Flops/byte, ex.time,  GFLOPS, GB/sec, Flops/byte, ex.time,  GFLOPS, GB/sec, Iops/byte, ex.time,   GIOPS, GB/sec
     0.000,  273.95,    0.00,  62.71,      0.000,  519.39,    0.00,  66.15,     0.000,  258.30,    0.00,  66.51
     0.065,  252.12,    4.26,  66.01,      0.032,  506.86,    2.12,  65.67,     0.065,  252.08,    4.26,  66.02
     0.133,  241.49,    8.89,  66.69,      0.067,  487.11,    4.41,  66.13,     0.133,  241.59,    8.89,  66.67
     0.207,  235.72,   13.67,  66.05,      0.103,  474.25,    6.79,  65.66,     0.207,  236.35,   13.63,  65.87
     0.286,  225.46,   19.05,  66.67,      0.143,  453.92,    9.46,  66.23,     0.286,  225.05,   19.08,  66.80
     0.370,  219.59,   24.45,  66.01,      0.185,  442.80,   12.12,  65.47,     0.370,  220.15,   24.39,  65.84
     0.462,  209.03,   30.82,  66.78,      0.231,  421.14,   15.30,  66.29,     0.462,  209.10,   30.81,  66.76
     0.560,  203.60,   36.92,  65.92,      0.280,  409.07,   18.37,  65.62,     0.560,  203.99,   36.85,  65.80
     0.667,  192.80,   44.55,  66.83,      0.333,  388.95,   22.09,  66.26,     0.667,  193.27,   44.44,  66.67
     0.783,  187.81,   51.46,  65.75,      0.391,  378.34,   25.54,  65.27,     0.783,  187.86,   51.44,  65.73
     0.909,  177.09,   60.63,  66.70,      0.455,  357.29,   30.05,  66.12,     0.909,  177.18,   60.60,  66.66
     1.048,  171.62,   68.82,  65.69,      0.524,  345.04,   34.23,  65.35,     1.048,  171.59,   68.83,  65.70
     1.200,  160.76,   80.15,  66.79,      0.600,  325.75,   39.55,  65.92,     1.200,  160.57,   80.24,  66.87
     1.368,  155.33,   89.86,  65.67,      0.684,  313.23,   44.56,  65.13,     1.368,  155.30,   89.88,  65.68
     1.556,  144.48,  104.05,  66.89,      0.778,  293.56,   51.21,  65.84,     1.556,  144.62,  103.95,  66.82
     1.765,  139.33,  115.60,  65.51,      0.882,  281.60,   57.20,  64.82,     1.765,  139.33,  115.60,  65.50
     2.000,  128.79,  133.40,  66.70,      1.000,  261.47,   65.70,  65.70,     2.000,  128.86,  133.32,  66.66
     2.267,  117.57,  155.26,  68.50,      1.133,  235.53,   77.50,  68.38,     2.267,  117.49,  155.36,  68.54
     2.571,  112.96,  171.10,  66.54,      1.286,  246.34,   78.46,  61.02,     2.571,  112.65,  171.57,  66.72
     2.923,  101.62,  200.77,  68.68,      1.462,  257.16,   79.33,  54.28,     2.923,  101.13,  201.72,  69.01
     3.333,   96.64,  222.22,  66.67,      1.667,  268.00,   80.13,  48.08,     3.333,   95.65,  224.51,  67.35
     3.818,   83.93,  268.65,  70.36,      1.909,  278.84,   80.86,  42.36,     3.818,   72.92,  309.24,  80.99
     4.400,   80.58,  293.16,  66.63,      2.200,  289.68,   81.55,  37.07,     4.400,   73.59,  321.00,  72.95
     5.111,   67.67,  364.96,  71.41,      2.556,  300.58,   82.16,  32.15,     5.111,   74.28,  332.49,  65.05
     6.000,   64.45,  399.83,  66.64,      3.000,  311.43,   82.75,  27.58,     6.000,   75.29,  342.26,  57.04
     7.143,   50.01,  536.76,  75.15,      3.571,  322.26,   83.30,  23.32,     7.143,   76.25,  352.04,  49.29
     8.667,   48.34,  577.52,  66.64,      4.333,  333.09,   83.81,  19.34,     8.667,   77.26,  361.33,  41.69
    10.800,   33.47,  866.12,  80.20,      5.400,  343.93,   84.29,  15.61,    10.800,   78.25,  370.48,  34.30
    14.000,   32.22,  932.99,  66.64,      7.000,  354.77,   84.74,  12.11,    14.000,   79.26,  379.32,  27.09
    19.333,   20.68, 1505.69,  77.88,      9.667,  376.91,   82.62,   8.55,    19.333,   80.27,  387.93,  20.07
    30.000,   19.37, 1663.32,  55.44,     15.000,  378.17,   85.18,   5.68,    30.000,   81.26,  396.41,  13.21
    62.000,   18.46, 1802.66,  29.08,     31.000,  389.93,   85.36,   2.75,    62.000,   33.57,  991.64,  15.99
       inf,   16.68, 2059.77,   0.00,        inf,  397.94,   86.34,   0.00,       inf,   33.54, 1024.43,   0.00
---------------------------------------------------------------------------------------------------------------

And here is "memory bandwidth" to "compute throughput" plot on the single precision floating point experiment results:

The source code of mixbench is freely provided, hosted at a github repository and you can find it at https://github.com/ekondis/mixbench. I would be happy to include results from other GPUs as well. Please try this tool and let me know about your extracted results and thoughts.

Saturday, July 4, 2015

mixbench: A GPU benchmark for mixed compute/transfer bound kernels

I have just released mixbench on github. It is a benchmark tool which assesses performance bounds on GPUs (compute or memory bound) under mixed workloads. Unfortunately, it's currently implemented on CUDA so only NVidia GPUs can be used. The compute part can be SP Flops, DP Flops or Int ops and the memory part is global memory traffic. Running the multiple experiments in a wide range of operational intensity values allows to examine the performance of GPUs under different kernel characteristics.

Running the program under a GTX-480 gives the following output:

mixbench (compute & memory balancing GPU microbenchmark)
------------------------ Device specifications ------------------------
Device:              GeForce GTX 480
CUDA driver version: 5.50
GPU clock rate:      1401 MHz
Memory clock rate:   924 MHz
Memory bus width:    384 bits
WarpSize:            32
L2 cache size:       768 KB
Total global mem:    1535 MB
ECC enabled:         No
Compute Capability:  2.0
Total SPs:           480 (15 MPs x 32 SPs/MP)
Compute throughput:  1344.96 GFlops (theoretical single precision FMAs)
Memory bandwidth:    177.41 GB/sec
-----------------------------------------------------------------------
Total GPU memory 1610285056, free 1195106304
Buffer size: 256MB
Trade-off type:compute with global memory (block strided)
---- EXCEL data ----
Operations ratio ;  Single Precision ops ;;;  Double precision ops ;;;    Integer operations   
  compute/memory ;    Time;  GFLOPS; GB/sec;    Time;  GFLOPS; GB/sec;    Time;   GIOPS; GB/sec
       0/32      ; 240.531;    0.00; 142.85; 475.150;    0.00; 144.63; 240.205;    0.00; 143.04
       1/31      ; 233.548;    9.20; 142.52; 460.193;    4.67; 144.66; 233.484;    9.20; 142.56
       2/30      ; 225.249;   19.07; 143.01; 445.144;    9.65; 144.73; 225.235;   19.07; 143.02
       3/29      ; 218.552;   29.48; 142.48; 430.575;   14.96; 144.64; 218.745;   29.45; 142.35
       4/28      ; 210.345;   40.84; 142.93; 415.425;   20.68; 144.74; 210.091;   40.89; 143.10
       5/27      ; 203.132;   52.86; 142.72; 400.472;   26.81; 144.78; 203.275;   52.82; 142.62
       6/26      ; 194.468;   66.26; 143.56; 385.434;   33.43; 144.86; 194.314;   66.31; 143.67
       7/25      ; 187.470;   80.19; 143.19; 370.915;   40.53; 144.74; 187.475;   80.18; 143.18
       8/24      ; 175.115;   98.11; 147.16; 355.723;   48.30; 144.89; 175.132;   98.10; 147.14
       9/23      ; 171.760;  112.53; 143.78; 341.353;   56.62; 144.70; 171.920;  112.42; 143.65
      10/22      ; 163.397;  131.43; 144.57; 326.007;   65.87; 144.92; 163.252;  131.54; 144.70
      11/21      ; 155.797;  151.62; 144.73; 311.655;   75.80; 144.70; 155.814;  151.61; 144.71
      12/20      ; 146.573;  175.82; 146.51; 296.386;   86.95; 144.91; 146.662;  175.71; 146.42
      13/19      ; 138.853;  201.06; 146.93; 281.757;   99.08; 144.81; 138.941;  200.93; 146.83
      14/18      ; 129.727;  231.75; 148.98; 266.401;  112.86; 145.10; 129.744;  231.72; 148.97
      15/17      ; 121.228;  265.72; 150.57; 251.283;  128.19; 145.28; 121.339;  265.47; 150.43
      16/16      ; 120.065;  286.18; 143.09; 235.740;  145.75; 145.75; 120.122;  286.04; 143.02
      17/15      ; 111.357;  327.84; 144.64; 219.472;  166.34; 146.77; 111.528;  327.34; 144.41
      18/14      ; 106.430;  363.19; 141.24; 231.498;  166.98; 129.87; 106.541;  362.82; 141.10
      19/13      ;  96.118;  424.50; 145.22; 243.534;  167.54; 114.63;  96.494;  422.85; 144.66
      20/12      ;  89.602;  479.34; 143.80; 256.247;  167.61; 100.57;  89.642;  479.13; 143.74
      21/11      ;  81.976;  550.13; 144.08; 269.055;  167.61;  87.80;  83.091;  542.74; 142.15
      22/10      ;  76.066;  621.10; 141.16; 282.898;  167.00;  75.91;  76.068;  621.08; 141.15
      23/ 9      ;  65.631;  752.57; 147.24; 295.743;  167.01;  65.35;  76.895;  642.33; 125.67
      24/ 8      ;  60.809;  847.57; 141.26; 307.479;  167.62;  55.87;  80.099;  643.45; 107.24
      25/ 7      ;  52.032; 1031.82; 144.45; 321.449;  167.02;  46.76;  83.296;  644.53;  90.23
      26/ 6      ;  48.321; 1155.49; 133.33; 334.305;  167.02;  38.54;  86.519;  645.35;  74.46
      27/ 5      ;  49.519; 1170.90; 108.42; 347.157;  167.02;  30.93;  89.729;  646.19;  59.83
      28/ 4      ;  50.704; 1185.90;  84.71; 360.013;  167.02;  23.86;  92.891;  647.31;  46.24
      29/ 3      ;  52.024; 1197.09;  61.92; 372.867;  167.02;  17.28;  96.115;  647.94;  33.51
      30/ 2      ;  53.377; 1206.97;  40.23; 385.722;  167.02;  11.13;  99.328;  648.61;  21.62
      31/ 1      ;  53.437; 1245.80;  20.09; 397.203;  167.60;   5.41; 101.247;  657.52;  10.61
      32/ 0      ;  53.558; 1283.08;   0.00; 410.012;  167.60;   0.00; 102.494;  670.47;   0.00
--------------------

The results for single and double precision Flops are illustrated in the following charts:
% of peak SP Flops and memory bandwidth performance related with the operational intensity
% of peak DP Flops and memory bandwidth performance related with the operational intensity
Compute throughput (SP Flops) vs memory bandwidth

Compute throughput (DP Flops) vs memory bandwidth

Publication:

Since this work was initially part of published research please cite the following publication where applicable:

Konstantinidis, E.; Cotronis, Y., "A Practical Performance Model for Compute and Memory Bound GPU Kernels," Parallel, Distributed and Network-Based Processing (PDP), 2015 23rd Euromicro International Conference on , vol., no., pp.651,658, 4-6 March 2015
doi: 10.1109/PDP.2015.51
URL: http://ieeexplore.ieee.org/stamp/stamp.jsp?tp=&arnumber=7092788&isnumber=7092002

Sunday, October 5, 2014

Least required GPU parallelism for kernel executions

GPUs require a vast number of threads per kernel invocation in order to utilize all execution units. As a first thought one should spawn at least the same number of threads as the number of available shader units (or CUDA cores or Processor Elements). However, this is not enough. The type of scheduling should be taken into account. Scheduling in Compute Units is done by multiple schedulers which in effect restricts the group of shader units in which a thread can execute. For instance the Fermi SMs consist of 32 shader units but at least 64 threads are required because 2 schedulers are evident in which the first can schedule threads only on the first group of 16 shader units and the other on the rest group. Thus a greater number of threads is required. What about the rest GPUs? What is the minimum threading required in order to enable all shader units? The answer lies on schedulers of compute units for each GPU architecture.

NVidia Fermi GPUs


Each SM (Compute Unit) consists of 2 schedulers. Each scheduler handles 32 threads (WARP size), thus 2x32=64 threads are the minimum required per SM. For instance a GTX480 with 15 CUs requires at least 960 active threads.


NVidia Kepler GPUs

Each SM (Compute Unit) consists of 4 schedulers. Each scheduler handles 32 threads (WARP size), thus 4x32=128 threads are the minimum requirement per SM. A GTX660 with 8 CUs requires at least 1024 active threads.

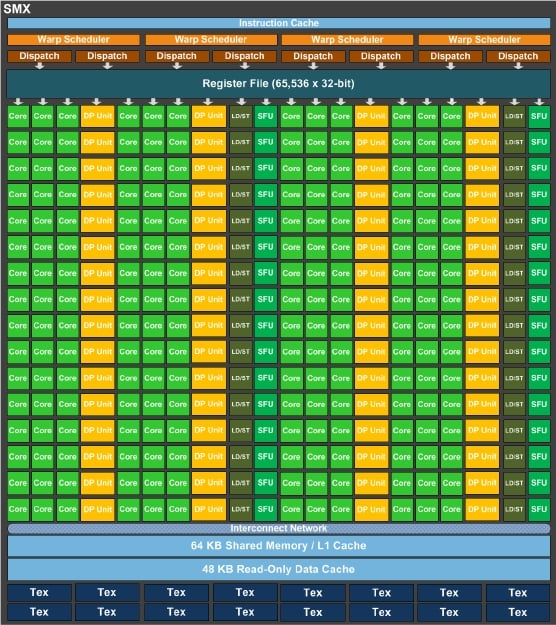
In addition, more independent instructions are required in the instruction stream (instruction level parallelism) in order to utilize the extra 64 shaders of each CU (192 in total).


NVidia Maxwell GPUs

Same as Kepler. A GTX660 with 8 CUs requires at least 1024 active threads. A GTX980 with 16 CUs requires 2048 active threads.

The requirement for instruction independency does not apply here (only 128 threads per CU).


AMD GCN GPUs

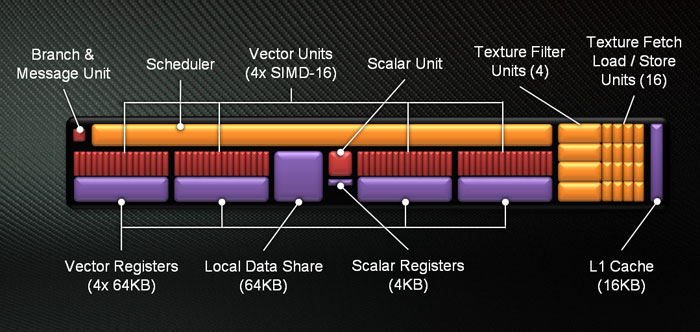
Regarding the AMD GCN units the requirement is more evident. This is because each scheduler handles threads in four groups, one for each SIMD unit. This is like having 4 schedulers per CU. Furthermore the unit of thread execution is done per 64 threads instead of 32. Therefore each CU requires the least of 4x64=256 threads. For instance a R9-280X with 32 CUs require a vast amount of 8192 threads! This fact justifies the reason for which in many research papers the AMD GPUs fail to stand against NVidia GPUs for small problem sizes where the amount of active threads is not enough.


Wednesday, October 2, 2013

A note on the GPU programming paradigm

GPU programming employ a highly aggresive parallelism model. When someone endeavors to program GPUs has to exploit dual levels of parallelism. These are the coarse grained and fine grained parallelism models.


The coarse grained model is the one that allows scalability as it relies on the blocks of threads which have no way to synchronize together. Therefore, they are able to execute independently in parallel, feeding all the available compute units of the hardware device. If the programmer has specified enough of them in a kernel invocation they will keep the hardware highly utilized. It resembles programming the CPU at the thread level, although without any efficient option to synchronize multiple threads together.

Speaking about fine grained parallelism is like programming down to the SIMD level provided by the use of SSE or AVX instructions available on modern Intel & AMD x86 CPUs. However, programming is quite more flexible as using the so called SIMT (Singe Instruction Multiple Thread) model, in CUDA or OpenCL programming environments, one can program without even being aware of the SIMD nature. NVidia GPUs' SIMD width is 32 elements while AMD GPUs' width is 64 elements. Practically, the thread block size should be a multiple of this number, especially on NVidia GPUs, because memory access and pipeline latencies require a large number of threads on the compute unit in order to be hidden. At this parallelism level, threads are able to synchronize and communicate by exhanging data through the fast shared memory.

In this sense, GPUs employ parallelism to extreme levels. A modern GPU would require more than a thousand threads per compute unit to keep it utilized and it might consists of dozens of compute units.

GPU programming is both fascinating and dirty!


Wednesday, August 14, 2013

My new teraflopper accelerator (?)

Althought the title above would seem to be eye catching some years ago, modern GPUs offer multiples of teraflops of compute power. Thus, my "slight" upgrading from GTX465 (Fermi based) to GTX660 (Kepler based) GPU appear as not so remarkable news.

Now, let me elaborate on what I mean by the word "slight". I mainly use the GPU as a development device for the CUDA and OpenCL environments (actually, I almost never use it for playing games). Therefore, I'm particularly interested on the compute performance of these cards. As it has been shown in various reviews the compute performance of Fermi based cards have proven more efficient than Kepler based cards. However, Kepler GPUs tend to be more power efficient.

The older GTX465
GTX660
Nevertheless, the GTX660 provides multiple benefits over the GTX465. First, the available memory on device is doubled, 2GB instead of 1GB. This is important as I can run compute kernels for bigger workloads. Additionally, the memory bandwidth is significantly higher, 144GB/sec instead of 102GB/sec. This proves usefull for memory bound kernels. Regarding the compute throughput of both cards the GTX465 features 855GFlops in single precision operations whilst the GTX660 features a decend 1880GFlops. All these in just 140W TDP instead of 200W TDP. This is why the GTX660 requires just one 6-pin power connector instead of 2.

Now, the drawback. The GTX660 exhibits significantly less peak performance in double precision operations as NVidia tends to criple double precision potential of desktop products on the Kepler GPUs by a factor of 1/24 rather than the 1/8 it did in the first Fermi generation. This yields a 78GFlops for the GTX660 and 106GFlops for the GTX465.
I definitely wanted GPU with CUDA support as most of my work is based on it so I couldn't consider getting a Radeon GPU. However, in the future I intend to focus on open standards i.e. OpenCL.

OpenCL performance of GTX 660

As I upgraded my GPU card I wanted to run some OpenCL benchmarks. I have developed a small tool that performs some benchmarks by identifying the best configuration in terms of workgroup size, vector size and workitem granularity on each kernel. I also included results from a Radeon HD7750 which is an even less power hungry card as it does not require a power connector at all.

AMD HD7750

Benchmark results:
Reduction
GB/sec
Leibniz formula for PI computation (SP)
GFLOPS
Leibniz formula for PI computation (DP)
GFLOPS
GTX465 89.56 304.26 26.56
GTX660 108.12 656.08 21.77
HD7750 63.15 214.45 13.81

Result chart:

It doesn't seems so bad. Memory bandwidth is improved and the single precision computations are more than doubled! As predicted the double precision computation exhibits a noticable performance drop but it can be tolerated.

Peak throughput numbers were used from the respective wikipedia pages:
http://en.wikipedia.org/wiki/GeForce_400_Series
http://en.wikipedia.org/wiki/GeForce_600_Series

Saturday, January 5, 2013

A GPGPU comparison (K20, 7970, GTX680, M2050 & GTX580)

I found a nice GPGPU comparison on a blog. It's very interesting as it exposes some practical benchmark results of all the latest GPUs in market in a range of 4 problems of different nature (bandwidth limited or compute intensive).

The GPUs compared are:

  1. NVidia Tesla K20
  2. NVidia GTX 680
  3. NVidia Tesla M2050
  4. AMD HD 7970

The 4 problems are:
  1. Digital Hydraulics
  2. Ambient Occlusion
  3. Running Sum
  4. Geometry Sampling
The results as presented are illustrated bellow:

As can be seen, the Keplel architecture is not as great as it was expected (at least the compute-optimized K20 chip). The older Fermi architecture seems to sustain a decent performance. In addition, the AMD GPU seem to be a good opponent exposing the benefits of the Southern Islands architecture in compute applications.

For the original full article click here:
http://wili.cc/blog/gpgpu-faceoff.html